Website Case Study
Live Bond Yields
Government bond yields for dozens of countries in one live, searchable table, on a tracker we own and operate.
At a Glance
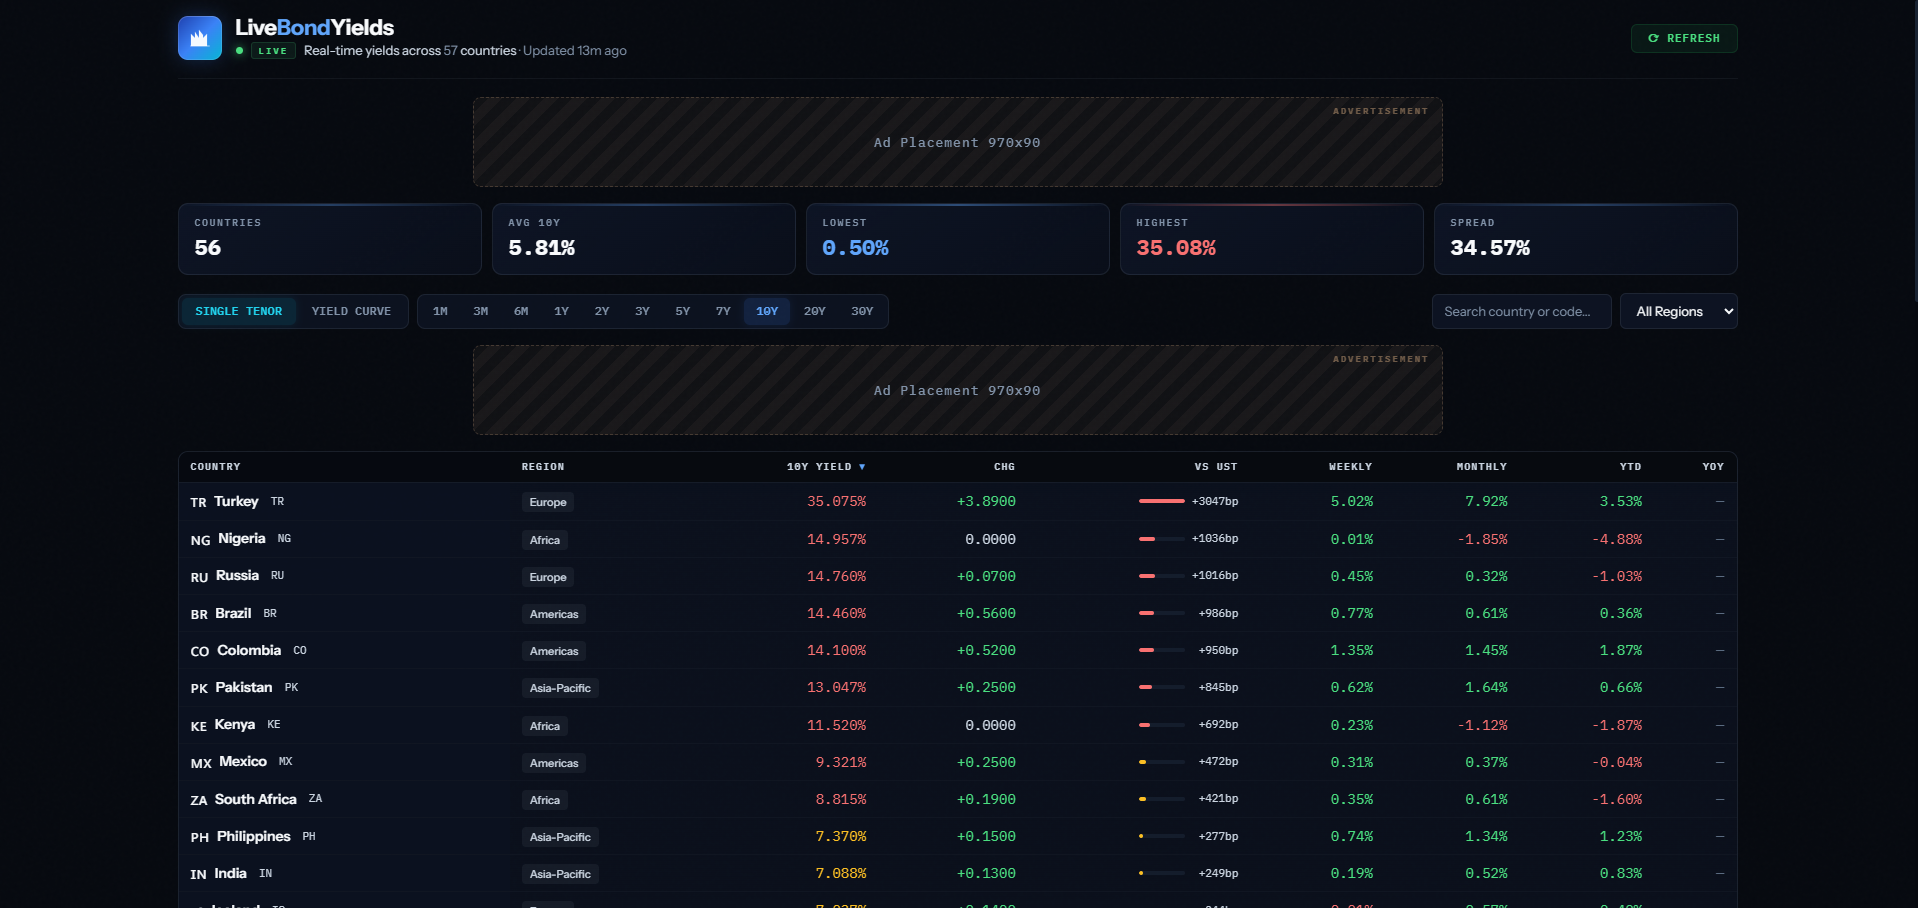
Live Bond Yields, a tracker we own and operate, puts government bond yields from around the world into one live table. Countries are ranked by 10-year yield, with daily, weekly, monthly, year-to-date and one-year changes and the spread against US Treasuries. Behind it, yield data is collected automatically across 11 maturities, and explainers, a FAQ and market updates sit beneath the table.
- Project
- Website
- Sector
- Finance: government bond markets
- Scope
- Single-page live table with explainers
- Highlights
- Spreads to Treasuries, 11 maturities, search
- Live site
- LiveBondYields.com
The Brief
Bond yields usually live in terminals and dense spreadsheets. Our brief to ourselves was one readable screen covering dozens of government markets, with enough explanation that a newcomer can follow along.
- Rank countries by 10-year yield in a single table, with flags and regions for quick orientation.
- Show momentum at a glance: one-day, one-week, one-month, year-to-date and one-year changes.
- Express each market's spread against US Treasuries in basis points.
- Explain yield curves and bond basics for readers who are new to fixed income.
What We Designed
There is no hero image here: the page opens straight onto the data, with a live indicator, a line confirming how recently the yields were updated and a refresh button. The table follows, one row per country with its flag, region, 10-year yield, one-day move, spread to US Treasuries and longer-term changes, and below it come sections on understanding global yields, reading the yield curve, a FAQ and bond market updates.
We paired Instrument Sans for labels and headings with IBM Plex Mono for the numbers, so decimal places line up and the eye can run straight down a column of yields. The palette is a deep navy-black with crisp white text and a green accent that marks the live state, which gives the figures as much contrast as possible.
Spreads to Treasuries
Each country's 10-year yield is set against US Treasuries in basis points, so relative value is clear.
Momentum columns
One-day, one-week, one-month, year-to-date and one-year changes sit side by side in every row.
Find a market fast
A search box and drop-down menus sit with the table, so a reader can go straight to the country they follow.
Yield curve explainers
Sections on global yields and reading the yield curve, plus an expandable FAQ, give the numbers their meaning.
How We Achieved It
Yield data is gathered automatically across 11 maturities, from one month out to 30 years, so the site can show full curves as well as the 10-year benchmark. The header states how long ago the figures were refreshed and offers a refresh button, which tells readers exactly how current the data is.
Beneath the table, written sections explain how government yields work and how to read a yield curve, and the FAQ uses expandable answers so it stays compact. The site carries a full set of legal policies, a contact form and a newsletter signup, and both forms are protected against spam with Google reCAPTCHA.
Keep Exploring
More Case Studies
Want a Website Like This?
Let's talk about what your business needs, or start with a custom five-page website for $49 US a month.