Website Case Study
Freight Barometer
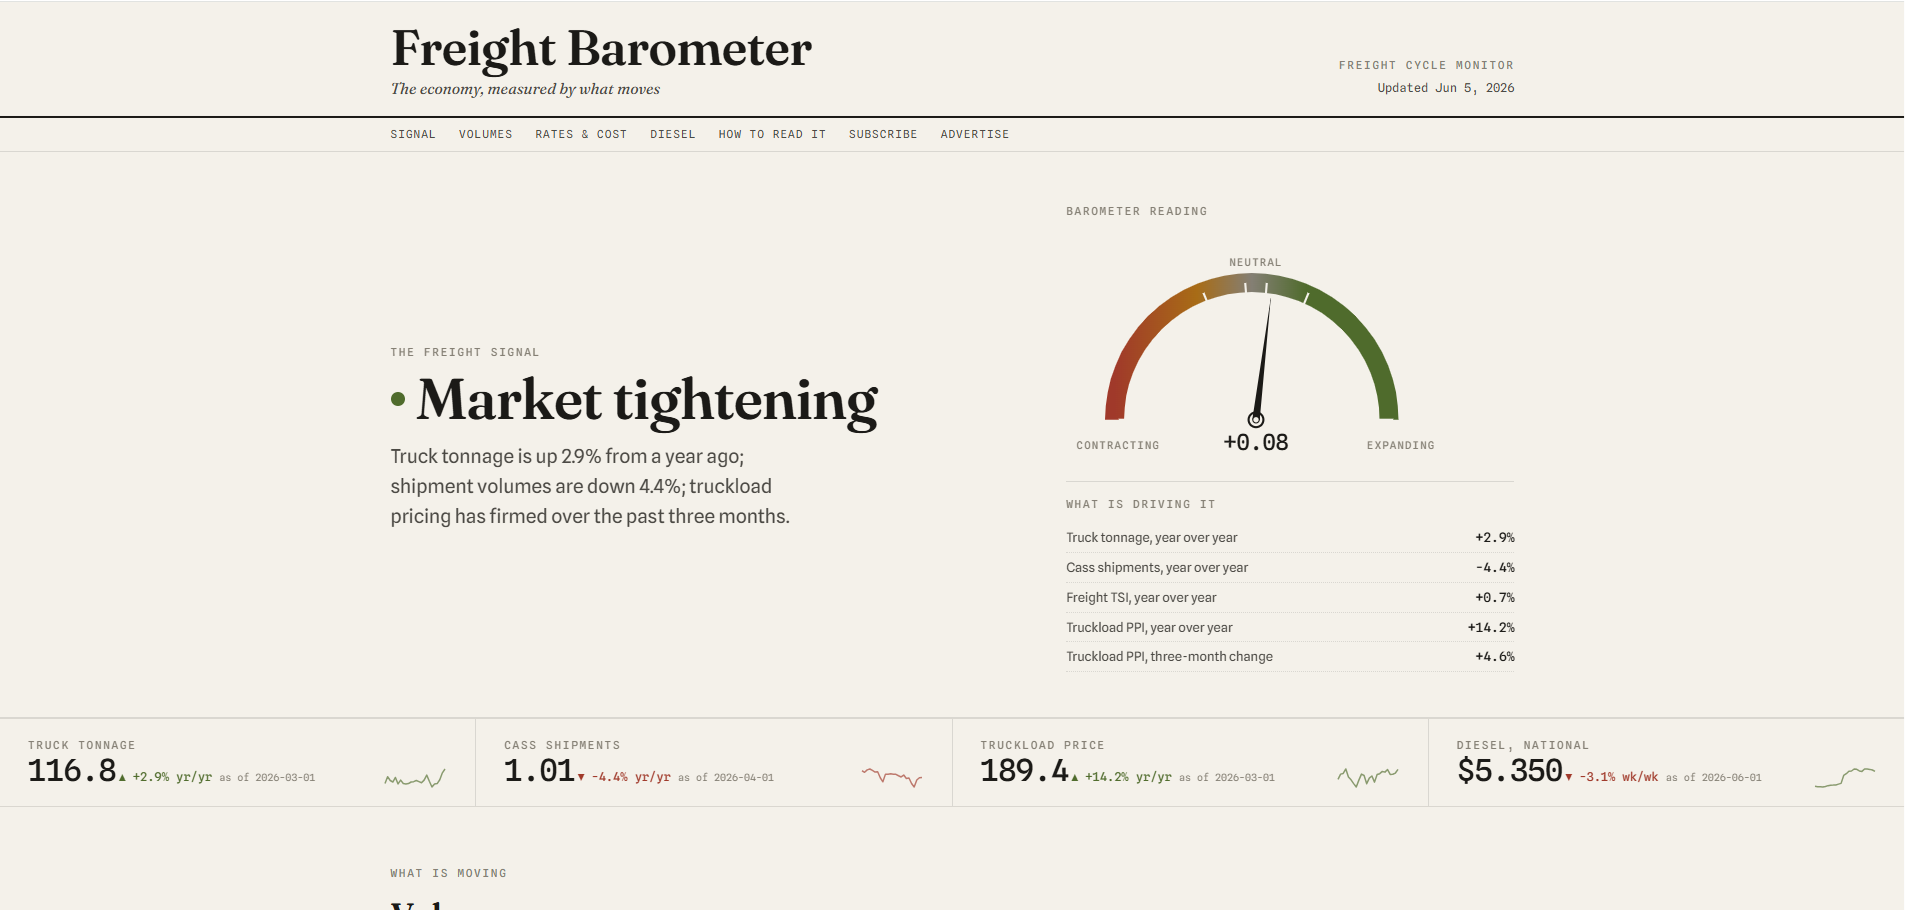
Our own live dashboard that reads the U.S. economy through freight, rolling tonnage, shipments, truckload prices and diesel into one barometer reading.
At a Glance
Freight Barometer is a freight and trucking data site that we own and operate. It brings U.S. truck tonnage, Cass shipments and expenditures, rail carloads and intermodal, the Freight TSI, truckload producer prices and national diesel onto a single page, then combines them into one freight cycle reading on a dial that runs from contracting to expanding. Below the dial, the series are charted one by one, each with a short note on what it shows.
- Project
- Website
- Sector
- Freight and transportation economics
- Scope
- Single-page live dashboard in six sections
- Highlights
- Barometer dial, ranged charts, named data sources
- Live site
- FreightBarometer.com
The Brief
The site rests on the idea in its own tagline: the economy, measured by what moves. Readers needed the freight signal first and the evidence for it right behind.
- Condense several freight series into one composite reading that anyone can place at a glance.
- Show what is driving the reading, measure by measure, with each year-over-year change beside it.
- Give volumes, rates and cost, and diesel their own sections, each with charts and a plain explanation.
- Credit every data source by name, from the Federal Reserve Bank of St. Louis to Cass Information Systems.
What We Designed
Visitors meet the masthead and its tagline first, then the signal itself: a short verdict such as Market tightening, a semicircular barometer that swings from contracting through neutral to expanding, and the exact reading. A list of what is driving it follows, then indicator cards for truck tonnage, Cass shipments, truckload price and national diesel, each stamped with the date of its latest figure.
Fraunces gives the headings the voice of a serious economics weekly, Spline Sans keeps the explanations plain, and Spline Sans Mono suits the columns of figures and percentage changes. We kept the palette to near-black ink on a warm, paper-toned background, closer to a printed market report than a trading terminal, which suits readers who settle in to compare series rather than watch a ticker.
Barometer dial
A semicircular gauge places the composite reading between contracting and expanding, with the exact figure and a written description alongside.
What is driving it
Year-over-year changes in tonnage, shipments, the Freight TSI and truckload prices sit under the dial, so the reading is never a black box.
Ranged charts
Charts switch between one, three and five years or the full history, setting short swings against the longer cycle.
Named sources
A sources and attribution section credits FRED, the Bureau of Transportation Statistics, the Bureau of Labor Statistics and Cass Information Systems.
How We Achieved It
Freight Barometer is a live page that shows when it was last updated. Volume and price series are retrieved from FRED at the Federal Reserve Bank of St. Louis, truck tonnage and freight indexes come courtesy of the U.S. Bureau of Transportation Statistics, the trucking price panel draws on producer prices from the U.S. Bureau of Labor Statistics, and the Cass Freight Index appears with attribution to Cass Information Systems.
In-page navigation runs Signal, Volumes, Rates and cost, Diesel, How to read it and Subscribe, so a regular reader can go straight to the series they track. An explainer on reading freight as an economic signal brings newcomers up to speed. The newsletter signup and the contact form both have spam protection, including Google reCAPTCHA, and a full favicon set completes the build.
Keep Exploring
More Case Studies
Want a Website Like This?
Let's talk about what your business needs, or start with a custom five-page website for $49 US a month.